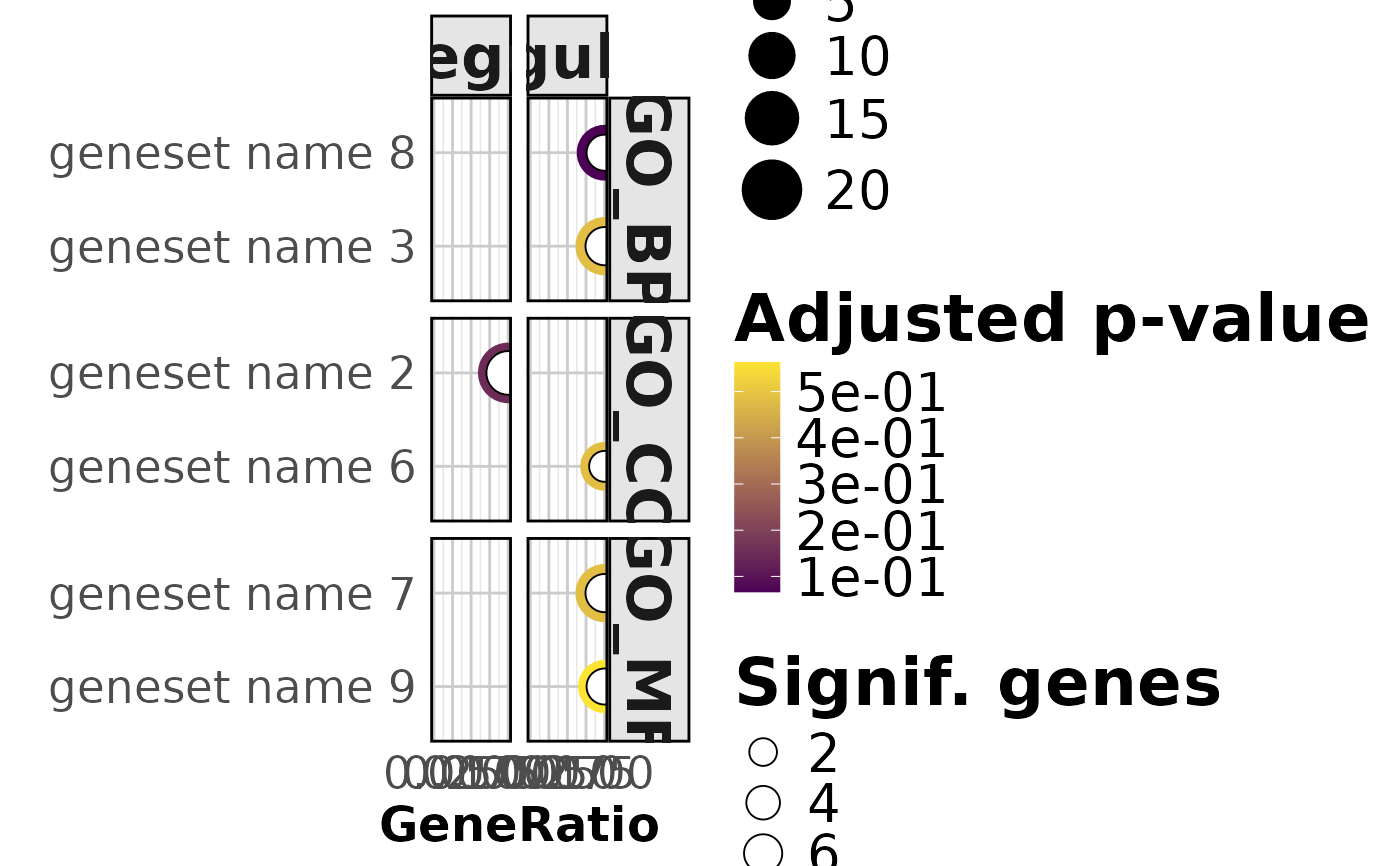
Shows enrichment terms from GO:BP, GO:CC, and GO:MF in a 3-row x 2-column grid (rows = source, columns = Upregulation/Downregulation). Within each source, highlighted terms are shown first (top), followed by auto-filled top terms by adjusted p-value.
plot_splitdot_combined(
  enrichment,
  topN = 5,
  highlight_terms = NULL,
  mode = "gene_ratio",
  show_signif_overlay = TRUE
)
Arguments
- enrichment
GOAT enrichment result containing multiple GO sources
- topN
Integer. Number of terms per source. Slots filled first by
highlight_termsmatches, then by top terms ranked by adjusted p-value. Default: 5.- highlight_terms
Character vector of term names or IDs to prioritize across all sources. Matched on
nameoridcolumns. Default:NULL.- mode
Character. Either
"gene_ratio"(default) or"pvalue". Controls x-axis and color legend only, same asplot_splitdot.- show_signif_overlay
Logical. When
TRUE, adds an inner black dot forngenes_signifon the same size scale asngenes. Default:TRUE.
Value
ggplot2 object. attr(p, "suggested_width") contains a suggested render width
in inches — see plot_splitdot.
Examples
get(load(system.file("extdata", "example_enrichment.rda", package = "goatea")))
#> # A tibble: 10 × 17
#>    source source_version id    name  parent_id ngenes_input ngenes ngenes_signif
#>    <chr>  <chr>          <chr> <chr> <list>           <int>  <int>         <int>
#>  1 origin org.Xx.eg.db   DB.0… gene… <chr [1]>           16     16             5
#>  2 origin org.Xx.eg.db   DB.0… gene… <chr [1]>           20     20             9
#>  3 origin org.Xx.eg.db   DB.0… gene… <chr [1]>           18     18             6
#>  4 origin org.Xx.eg.db   DB.0… gene… <chr [1]>           18     18             6
#>  5 origin org.Xx.eg.db   DB.0… gene… <chr [1]>           11     11             3
#>  6 origin org.Xx.eg.db   DB.0… gene… <chr [1]>           14     14             5
#>  7 origin org.Xx.eg.db   DB.0… gene… <chr [1]>           12     12             7
#>  8 origin org.Xx.eg.db   DB.0… gene… <chr [1]>           14     14             6
#>  9 origin org.Xx.eg.db   DB.0… gene… <chr [1]>           13     13             5
#> 10 origin org.Xx.eg.db   DB.0… gene… <chr [1]>           17     17             5
#> # ℹ 9 more variables: genes <list<int>>, genes_signif <list>, score_type <chr>,
#> #   pvalue <dbl>, zscore <dbl>, pvalue_adjust <dbl>, signif <lgl>,
#> #   score_oddsratio <dbl>, symbol <list>
example_enrichment$source <- rep(c("GO_BP", "GO_CC", "GO_MF"), 4)[1:10]
plot_splitdot_combined(example_enrichment, topN = 2)