Plot splitdot plot
plot_splitdot(
  enrichment,
  topN = NA,
  mode = "gene_ratio",
  show_signif_overlay = TRUE
)
Arguments
- enrichment
GOAT enrichment result, pre-sorted in the desired display order (top row appears at top of plot)
- topN
default: NA to plot all, else integer to plot topN terms (first N rows)
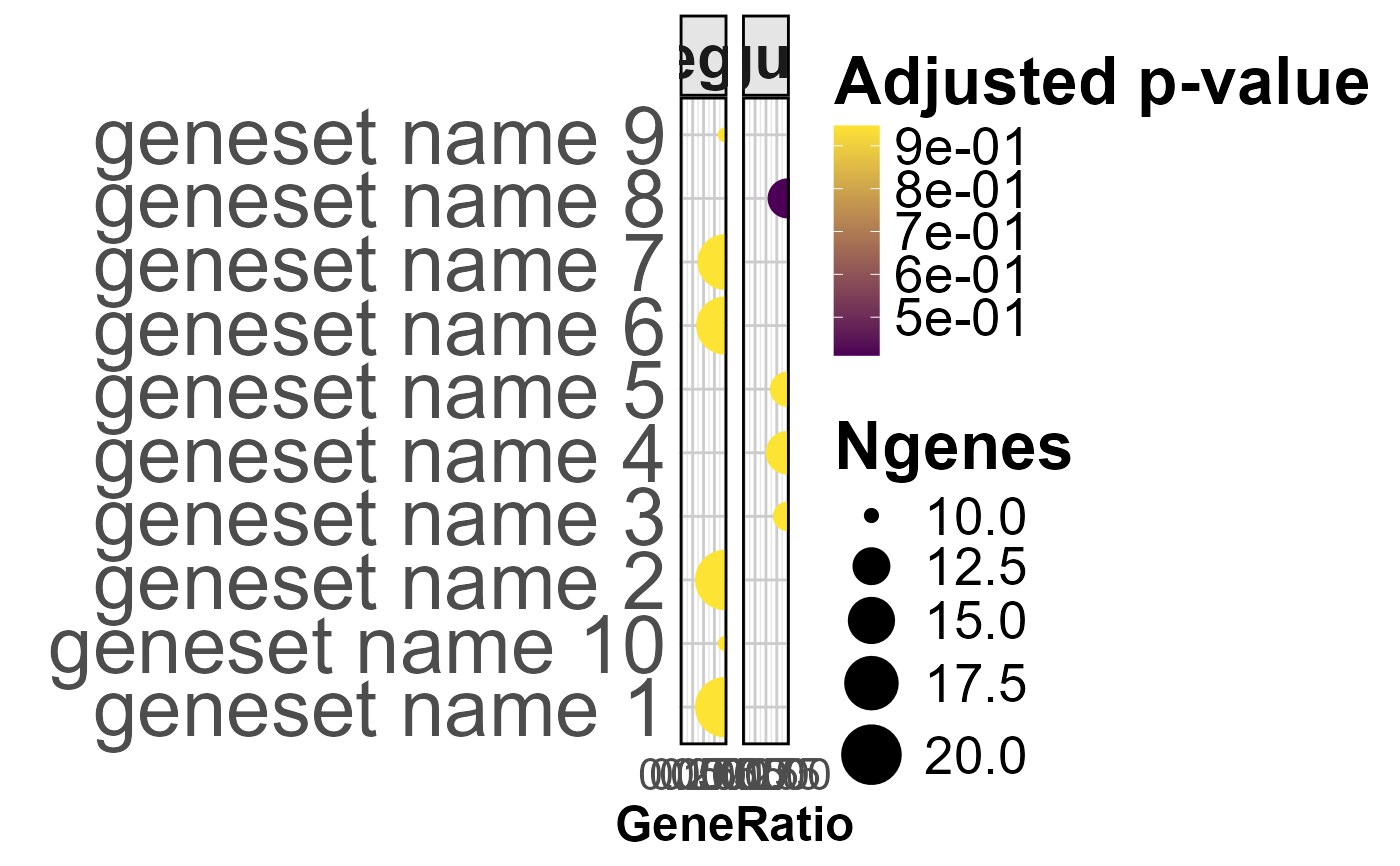
- mode
Character. Either
"gene_ratio"(default) or"pvalue". Controls x-axis and color legend only; row order is taken from the input data."gene_ratio": x = GeneRatio, color = adjusted p-value."pvalue": x = adjusted p-value, color = GeneRatio.- show_signif_overlay
Logical. When
TRUE, adds an inner black dot representingngenes_signifon the same size scale asngenes. Default:TRUE.
Value
ggplot2 object. attr(p, "suggested_width") contains a suggested render width
in inches based on the longest term label — pass to ggsave(width = ...) or
renderPlot(width = ... * 96) in Shiny.
Examples
plot_splitdot(
  get(load(system.file("extdata", "example_enrichment.rda", package = "goatea")))
)