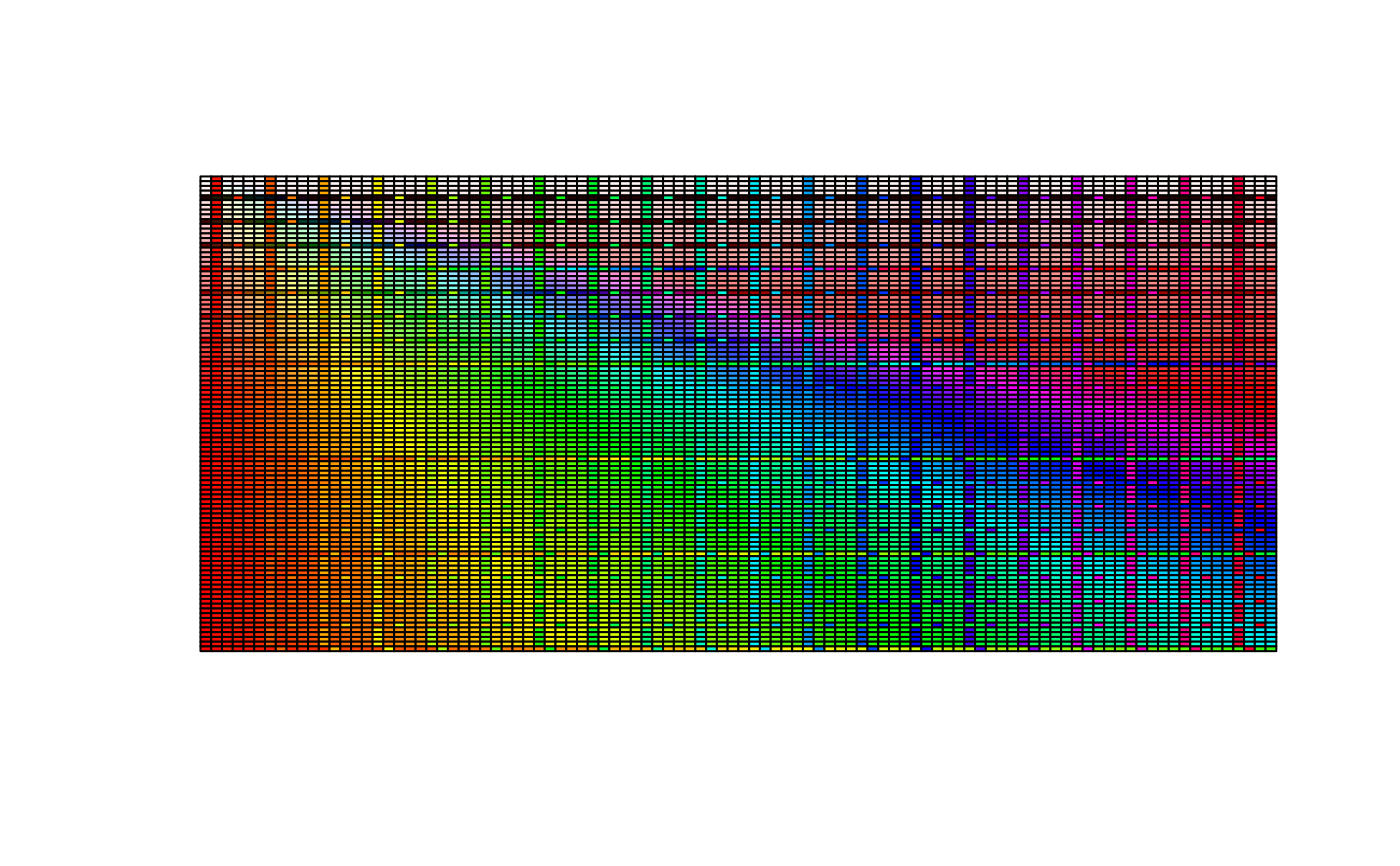
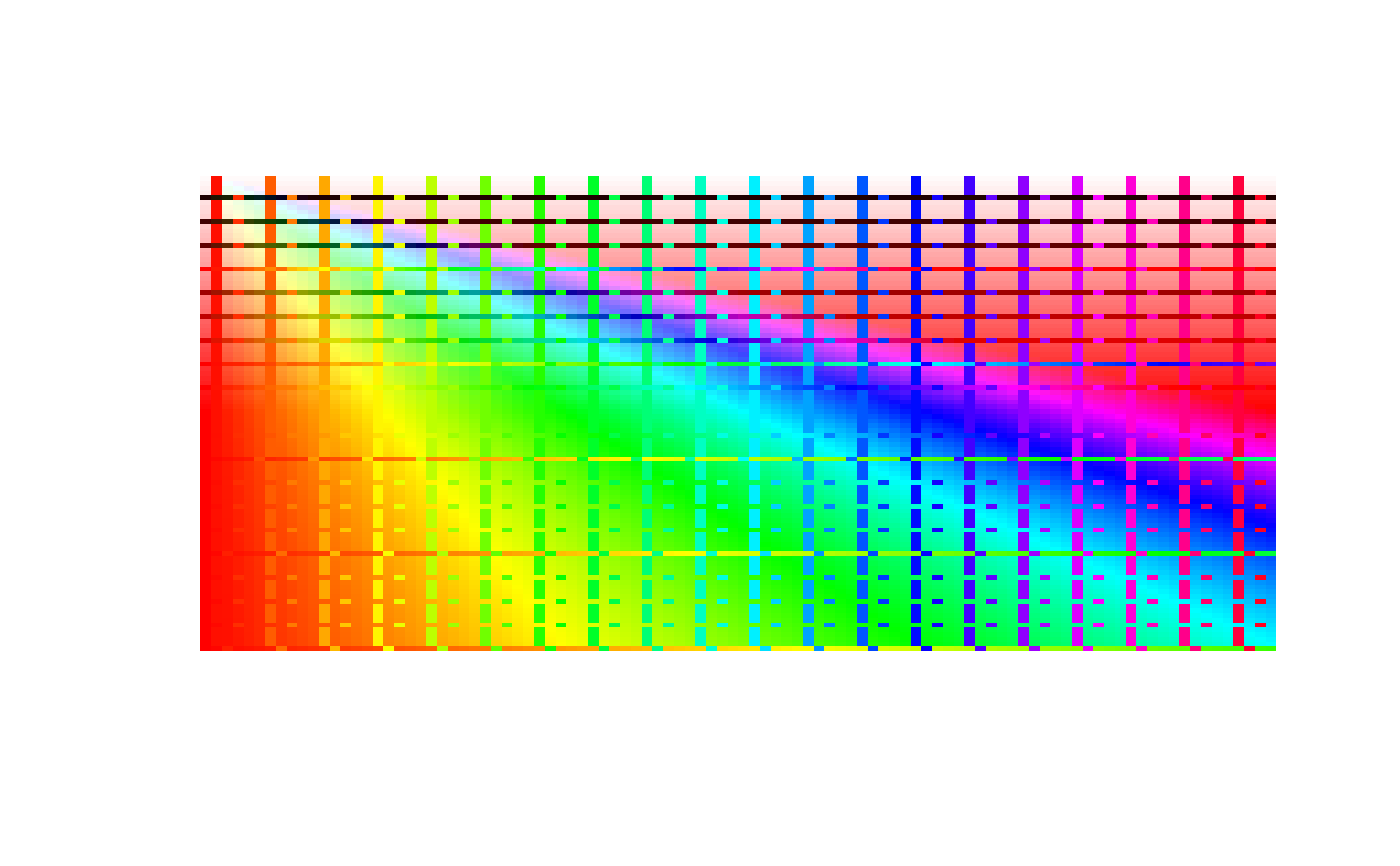
Colortistry plot from Colorified palettes
Arguments
- colors_list
list of colors generated with
colorify, see example- border_color
default: NA, for no border, otherwise R grDevices color or hexcolor
Examples
colors_list <- list()
for (i in seq(100)) {
  colors_list[[i]] <- colorify(
  n = 100,
  colors = "rainbow",
  colors_lock = rep(c(TRUE,FALSE,FALSE,FALSE,FALSE), 20),
  hf = 25/i,
  lf = i/20)
  if (i %% 3) colors_list[[i]] <- colorify(
  n = 100,
  colors = "rainbow",
  colors_lock = rep(c(FALSE,FALSE,TRUE,FALSE,FALSE), 20),
  hf = 30/i,
  lf = i/20)
  if (i %% 4) colors_list[[i]] <- colorify(
  n = 100,
  colors = "rainbow",
  colors_lock = rep(c(FALSE,FALSE,FALSE,TRUE,FALSE), 20),
  hf = 50/i,
  lf = i/40)
  if (i %% 5) colors_list[[i]] <- colorify(
  n = 100,
  colors = "rainbow",
  colors_lock = rep(c(FALSE,TRUE,FALSE,FALSE,FALSE), 20),
  hf = 50/i,
  sf = i/50)
}
colortistry(colors_list)

colortistry(colors_list, border_color = 'black')